-

北京天演融智软件有限公司
主营:matlab,stata,spsspro,pscad,gams,nvivo,cyme,gms,mathematica

北京天演融智软件有限公司
主营:matlab,stata,spsspro,pscad,gams,nvivo,cyme,gms,mathematica 4
4
科学软件网提供的软件上千款,涉及所有学科领域,您所需的软件,我们都能提供。
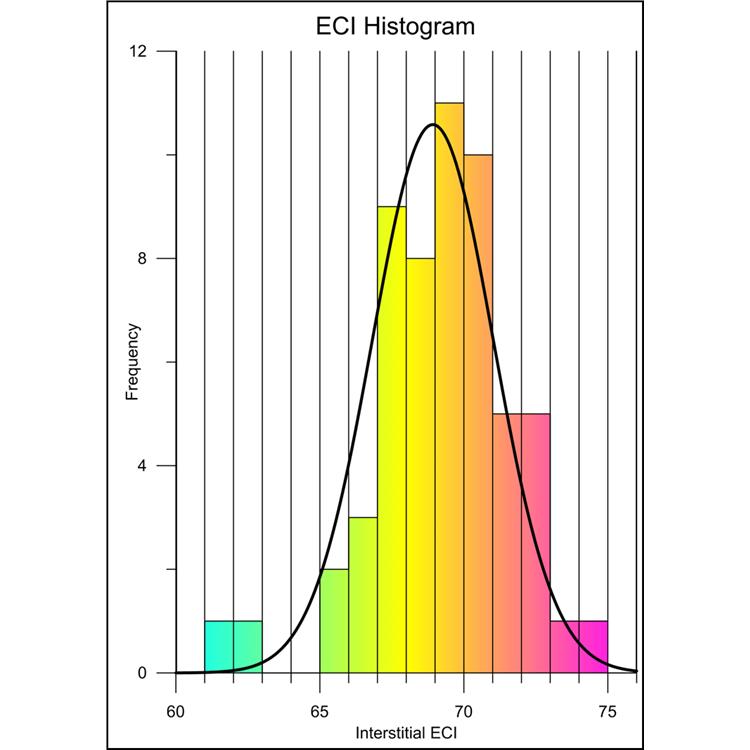
数据可视化 好的呈现您的数据。Grapher提供70多种2D和3D绘图选项来大限度的显示数据。 分析数据 **数据可能隐藏的有价值信息。使用Grapher广泛的分析图表、工具和统计功能来识别趋势,找到新的见解和定位机会。Grapher提供对数据的整体视图。 轻松自动化工作 不用浪费时间重复一样的工作。创建脚本来自动执行重复性任务,并直接从Grapher任务栏中运行您喜欢的脚本。
The sample scripts folder is located at C:\Program Files\Golden Software\Grapher 13\Samples\Scripts by default. The is displayed in the Manager. 5. Click the button to execute the .
Represent Data at Its Best Control every aspect of your plot down to the smallest detail. Grapher’s extensive customization options allow you to convey complex ideas in an easy-to-understand manner. Grapher displays your data at its very best. Grapher Customization Options Add legends, titles, and axes Include inset zoom or graph magnifier Edit all axis parameters, multiple axes Format axis scales as linear, logarithmic, natural logarithmic, probability, or date/time Combine multiple graphs Add fit curves, error bars, and statistical reports Place every graph component in a precise location Define custom line styles, colors, and fills Edit text, line, fill and symbol properties Add text, polylines, polygons, symbols, and spline polylines Many more…
Grapher统计工具: 插入自定义或预定义的拟合曲线 运用置信区间 包括错误条 对原始数据进行统计计算 显示统计报告 完全兼容 无缝地可视化和分析来自多个数据源的数据。Grapher可以读取多种文件格式,包括ACCDB、DBF和XLSL。Grapher还支持多种流行的输出格式。轻松管理Grapher中的数据。 自信的协助 迅速与同事、利益相关者和客户分析您的图表。快速输出可打印的高质量格式,如PDF或TIFF,或输出PNG或SVG格式在线共享您的工作。另外,Grapher能轻松的插入图表到演示工具中,一个简单的复制粘贴就能插入到Microsoft Word或PowerPoint中。
科学软件网不仅提供软件产品,更有多项附加服务免费提供,让您售后**!科学软件网不定期举办各类公益培训和讲座,让您有更多机会免费学习和熟悉软件。
http://turntech88.b2b168.com
欢迎来到北京天演融智软件有限公司网站, 具体地址是北京市海淀区海淀街道上地东路35号院1号楼3层1-312318、1-312-319,联系人是张经理。
主要经营北京天演融智软件有限公司主营产品SPSSPRO,Stata,GAMS,Matlab,PSCAD,CYME,GMS,SnapGene等各学科软件,科学软件网拥有近20年的软件销售经验,提供专业软件销售和培训服务,还有更多的增值服务。目前,科学软件网提供的软件有数百种,软件涵盖的领域包括,经管,仿真,地球地理,生物化学,工程科学,排版及网络管理等各个学科。同时,我们还有40款软件,80门视频课程。
。
单位注册资金未知。
我们的产品优等,服务优质,您将会为选择我们而感到放心,我们将会为得到您认可而感到骄傲。